Presented by Matthew Glova
Markets rebound in April
Equity markets saw a swift recovery in April, as progress toward slowing the spread of the coronavirus gave investors hope. The S&P 500 rose by 12.82 percent, marking the best monthly gain since 1987. The Dow Jones Industrial Average (DJIA) gained 11.22 percent, and the Nasdaq Composite gained 15.49 percent.
These impressive results came despite worsening fundamentals. According to Bloomberg Intelligence, as of April 30, the blended average earnings growth rate for the S&P 500 for the first quarter sat at –16.4 percent. If the final earnings come in at this level, it would be the worst quarterly result since the second quarter of 2009.
Technical factors for U.S. markets were mixed. The S&P 500 and DJIA both spent April below their respective 200-day moving averages. The Nasdaq, however, was able to break through and finish April above its 200-day moving average. This is an important technical signal, as a prolonged break above trend could indicate a shift in investor sentiment.
The story was similar internationally. The MSCI EAFE Index gained 6.46 percent, bolstered by reopening efforts across select European countries. Emerging markets fared even better, gaining 9.18 percent. Despite these strong returns, both indices spent the month below their 200-day moving averages.
Fixed income also had a strong month. The 10-year Treasury yield was largely range bound, starting April at 0.62 percent and finishing at 0.64 percent. The Federal Reserve (Fed) left rates unchanged at its April meeting. Fed Chair Jerome Powell reiterated that the Fed will provide much-needed support during these uncertain times.
The Bloomberg Barclays U.S. Aggregate Bond Index gained 1.78 percent during the month. High-yield bonds fared even better, with the Bloomberg Barclays U.S. Corporate High Yield Index gaining 4.51 percent.
States begin reopening as coronavirus growth slows
In April, we saw real progress in the fight against the coronavirus. Case counts continue to increase, but the pace of growth for new cases has been falling. This shows the positive impact widespread social distancing has had on containing the virus.
Given the progress we saw in April, some states have started opening up their economies. It will take at least a couple of weeks to get a clear picture of exactly how reopening will affect new case counts, however.
Large-scale testing capabilities in the U.S. remain below levels called for by experts in order to safely reopen large swaths of the economy. Ultimately, testing will be the key tool to allow us to safely open up the economy until a vaccine is available.
Economic data highlights costs of lockdown
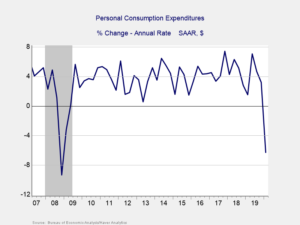
Figure 1. Personal Consumption Expenditures, 2007–Present
Although there was positive news on the coronavirus front, the economic data released in April was terrible, as expected. More than 30 million Americans filed initial jobless claims over the past 6 weeks. Gross domestic product (GDP) contracted by an annualized rate of 4.8 percent in the first quarter, signaling that we are likely in a recession. Personal consumption, the major driver of economic growth last year, experienced its biggest decline since the fourth quarter of 2008, as you can see in Figure 1.
This drop in consumer spending highlights the risks April’s extended lockdowns pose to second-quarter growth. Consumer confidence plummeted during the month. A V-shaped recovery will largely rely on a swift rebound in consumer confidence and spending.
Businesses also suffered in April. Both manufacturers and the service sector saw declining confidence and output. Industrial production experienced its largest drop since 1946. Business confidence now sits at levels that have historically indicated a double-digit contraction in GDP is possible.
Pandemic and economic risks remain, despite April market recovery
April was a surprisingly good month for markets, but it was the opposite for the economy. The rebound we saw in equities, combined with the cratering earnings outlook, indicates that markets are pricing in a faster recovery. So significant risk remains if the recovery is not as swift as markets expect.
In this environment of uncertainty, we can expect further volatility, even as we continue to make real progress. As always, maintaining a well-diversified portfolio that matches investor goals and timelines remains the best path forward.
Click here for a PDF of this Market Update – April 2020
All information according to Bloomberg, unless stated otherwise.
Disclosure: Certain sections of this commentary contain forward-looking statements based on our reasonable expectations, estimates, projections, and assumptions. Forward-looking statements are not guarantees of future performance and involve certain risks and uncertainties, which are difficult to predict. Past performance is not indicative of future results. Diversification does not assure a profit or protect against loss in declining markets. All indices are unmanaged and investors cannot invest directly into an index. The Dow Jones Industrial Average is a price-weighted average of 30 actively traded blue-chip stocks. The S&P 500 Index is a broad-based measurement of changes in stock market conditions based on the average performance of 500 widely held common stocks. The Nasdaq Composite Index measures the performance of all issues listed in the Nasdaq Stock Market, except for rights, warrants, units, and convertible debentures. The MSCI EAFE Index is a float-adjusted market capitalization index designed to measure developed market equity performance, excluding the U.S. and Canada. The MSCI Emerging Markets Index is a market capitalization-weighted index composed of companies representative of the market structure of 26 emerging market countries in Europe, Latin America, and the Pacific Basin. It excludes closed markets and those shares in otherwise free markets that are not purchasable by foreigners. The Bloomberg Barclays Aggregate Bond Index is an unmanaged market value-weighted index representing securities that are SEC-registered, taxable, and dollar-denominated. It covers the U.S. investment-grade fixed-rate bond market, with index components for a combination of the Bloomberg Barclays government and corporate securities, mortgage-backed pass-through securities, and asset-backed securities. The Bloomberg Barclays U.S. Corporate High Yield Index covers the USD-denominated, non-investment-grade, fixed-rate, taxable corporate bond market. Securities are classified as high-yield if the middle rating of Moody’s, Fitch, and S&P is Ba1/BB+/BB+ or below.
###
LifeTime Asset Management is located at 4700 Homewood Ct, Suite 340, Raleigh, NC 27609 and can be reached at 919.845.5315. This communication strictly intended for individuals residing in the states of AL, AR, AZ, CO, CT, FL, GA, IA, IL, IN, KS, MA, MD, MI, MO, NC, NE, NH, NY, OH, OK, PA, RI, SC, TX, VA, VT, WA, WV. No offers may be made or accepted from any resident outside these states due to various state regulations and registration requirements regarding investment products and services.
Investments are not FDIC- or NCUA-insured, are not guaranteed by a bank/financial institution, and are subject to risks, including possible loss of the principal invested. Securities and advisory services offered through Commonwealth Financial Network®. Member FINRA, SIPC, a Registered Investment Advisor.
Authored by Brad McMillan, CFA®, CAIA, MAI, managing principal, chief investment officer, and Sam Millette, senior investment research analyst, at Commonwealth Financial Network®.
© 2020 Commonwealth Financial Network®