Presented by Matt Glova and the team at LifeTime Asset Management
More tricks than treats for markets in October
October was a challenging month for markets. The strong start to the month was offset by rising COVID-19 case counts, which led to a sell-off at month-end. The S&P 500 lost 2.66 percent in October, while the Nasdaq Composite declined by 2.26 percent. The Dow Jones Industrials Average (DJIA) suffered the largest decline, losing 4.52 percent.
This volatility came despite improving fundamentals during the month. According to Bloomberg Intelligence, as of October 30 with 63 percent of companies having reported results, the blended third-quarter earnings decline for the S&P 500 sits at 10.7 percent. If earnings end the quarter at this level, it would be a much better result than the roughly 31 percent decline we saw in the second quarter. It would also be stronger than analyst estimates at the start of earnings season for a 21.5 percent decline. The better-than-expected results were widespread, with roughly 85 percent of companies showing earnings per share above expectations. Fundamentals drive long-term performance, so these results are a comforting sign that companies continued to recover throughout the third quarter.
Technical factors were also supportive during the month, but there are signs that markets are approaching potential danger levels. All three major indices remained above their respective 200-day moving averages during the month. The sell-off near month-end brought the DJIA close to this important technical level, however. The 200-day moving average is a widely followed technical indicator. Sustained breaks above or below this level tend to signal shifting investor sentiment for an index. While the continued technical support was encouraging, additional volatility in November could cause one or more of the major indices to break below trend.
Internationally, the story was much the same. The MSCI EAFE Index declined by 3.99 percent during the month. The pandemic’s international growth spooked investors, and announcements of new lockdowns across much of Europe highlighted the continued risks COVID-19 presents. Emerging markets, on the other hand, outperformed in October. The MSCI Emerging Markets Index returned a positive 2.08 percent for the month. Technicals for international stocks were mixed. The volatility at month-end caused the MSCI EAFE Index to end the month below its 200-day moving average for the first time in three months. The MSCI Emerging Markets Index remained well above its trend line, despite some volatility at month-end.
Fixed income had a challenging month, as rising long-term interest rates weighed on investor sentiment. The 10-year U.S. Treasury yield rose from 0.68 percent at the start of the month to 0.88 percent at month-end. This result was driven in large part by rising expectations for growth and inflation. The Bloomberg Barclays U.S. Aggregate Bond Index lost 0.45 percent in October. High-yield fixed income, which is less tied to movements in interest rates, had a positive month. The Bloomberg Barclays U.S. Corporate High Yield Index gained 0.51 percent. High-yield spreads declined during the month, indicating rising investor tolerance for lower yields.
Worsening public health outlook rocks markets
As we saw earlier in the summer, increasing medical risks created uncertainty and led to a rise in volatility. The number of new daily cases rose throughout October and finished the period at a new high. We ended the month with a seven-day average of more than 81,000 new cases per day, notably higher than July’s peak of approximately 69,000. This led to a rise in total active cases at month-end, after a period of stability throughout September and the start of October.
On the testing front, the news was better, as we continued to see an increase in the number of daily tests throughout the month. While the volume of testing increased, the positive test rate also rose. This is a sign that even with increased testing, we are still falling behind in identifying and containing the most recent surge in cases. We ended the month with a seven-day average positive test rate of 6.5 percent, which is above the World Health Organization’s 5 percent maximum target positive test rate.
Overall, medical risks rose during the month. We are now in the middle of a national third wave of pandemic spread, with signs pointing to this wave being worse than the previous two. Given the rising medical risks, the market volatility we saw makes sense—if anything, it leaves us wondering why things weren’t worse for markets in October.
Economy shows resilience during uncertain month
We can thank the continued economic recovery for blunting some of the negative effects of rising medical risks. Much of the economic data released in October showed a surprisingly resilient recovery, with better-than-expected results for wide swaths of the economy. Notable highlights include consumer sentiment and spending, which showcased the continued strength of the American consumer. Retail sales, for example, rose by 1.9 percent in September against calls for a more modest 0.8 percent increase. Personal income and spending also came in above expectations during the month, and we saw improvements in the pace of weekly layoffs as well.
Business confidence and spending also impressed. Business confidence, as measured by the Institute for Supply Management Composite index of manufacturer and service sector confidence, rose in September to its second-highest level since the pandemic hit. It now sits well above pre-pandemic levels, and there is evidence that rising confidence helped support faster business investment. Durable goods orders rose by more than expected, signaling strong business spending during the month.
One area of notable strength was the housing market, which continues to be a bright spot in the ongoing economic recovery. Home builder confidence set a new high in October, as low mortgage rates and falling timber prices boosted confidence above previous record levels. The record-low mortgage rates we’ve seen throughout the summer and fall continue to drive prospective homebuyers into the market, with the pace of housing sales increasing notably once reopening efforts began. As you can see in Figure 1, the pace of existing home sales rose to its highest level since 2006 in September, highlighting the very impressive rebound we’ve seen in the housing sector this year.
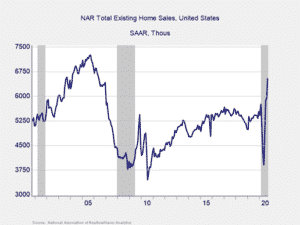
Figure 1. Existing Home Sales, September 2000–Present
Risks rising despite economic recovery
Despite the continued economic improvement we saw in October, the worsening public health picture indicates risks are rising as we head into the end of the year. November is likely to show results similar to October’s on both the medical and economic fronts, and further market volatility is possible, if not likely.
Political risks are also very real, both here and abroad. Domestically, the election at the start of the month created uncertainty for investors, and there is the potential for this uncertainty to extend for weeks or months. Looking abroad, worsening U.S.-China trade relations are expected to serve as a potential challenge regardless of the results of the election, while the prospect of a hard Brexit at year-end remains a distinct possibility for the U.K. and the European Union.
Although a period of uncertainty and volatility is likely, the economic recovery is expected to continue. Good news on the economic front may ease some of the negative impact and market turbulence caused by these rising risks. A well-diversified portfolio that matches investor goals and timelines remains the best path forward for most. If concerns remain, however, you should contact your financial advisor to review your financial plans.
All information according to Bloomberg, unless stated otherwise.
Disclosure: Certain sections of this commentary contain forward-looking statements based on our reasonable expectations, estimates, projections, and assumptions. Forward-looking statements are not guarantees of future performance and involve certain risks and uncertainties, which are difficult to predict. Past performance is not indicative of future results. Diversification does not assure a profit or protect against loss in declining markets. All indices are unmanaged and investors cannot invest directly into an index. The Dow Jones Industrial Average is a price-weighted average of 30 actively traded blue-chip stocks. The S&P 500 Index is a broad-based measurement of changes in stock market conditions based on the average performance of 500 widely held common stocks. The Nasdaq Composite Index measures the performance of all issues listed in the Nasdaq Stock Market, except for rights, warrants, units, and convertible debentures. The MSCI EAFE Index is a float-adjusted market capitalization index designed to measure developed market equity performance, excluding the U.S. and Canada. The MSCI Emerging Markets Index is a market capitalization-weighted index composed of companies representative of the market structure of 26 emerging market countries in Europe, Latin America, and the Pacific Basin. It excludes closed markets and those shares in otherwise free markets that are not purchasable by foreigners. The Bloomberg Barclays Aggregate Bond Index is an unmanaged market value-weighted index representing securities that are SEC-registered, taxable, and dollar-denominated. It covers the U.S. investment-grade fixed-rate bond market, with index components for a combination of the Bloomberg Barclays government and corporate securities, mortgage-backed pass-through securities, and asset-backed securities. The Bloomberg Barclays U.S. Corporate High Yield Index covers the USD-denominated, non-investment-grade, fixed-rate, taxable corporate bond market. Securities are classified as high-yield if the middle rating of Moody’s, Fitch, and S&P is Ba1/BB+/BB+ or below.
###
LifeTime Asset Management is located at 4700 Homewood Ct. Suite 340, Raleigh, NC 27609, and can be reached at 919-845-5315. Securities and Advisory Services offered through Commonwealth Financial Network, Member FINRA/SIPC, a Registered Investment Adviser. Fixed Insurance products and services offered through CES Insurance Agency.
Authored by Brad McMillan, CFA®, CAIA, MAI, managing principal, chief investment officer, and Sam Millette, senior investment research analyst, at Commonwealth Financial Network®.
© 2020 Commonwealth Financial Network®